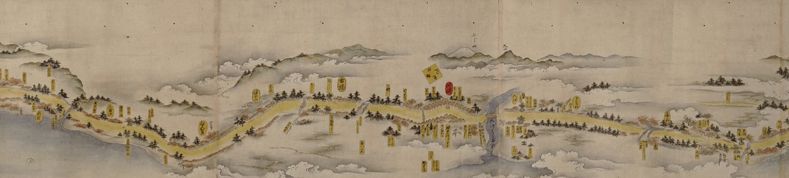
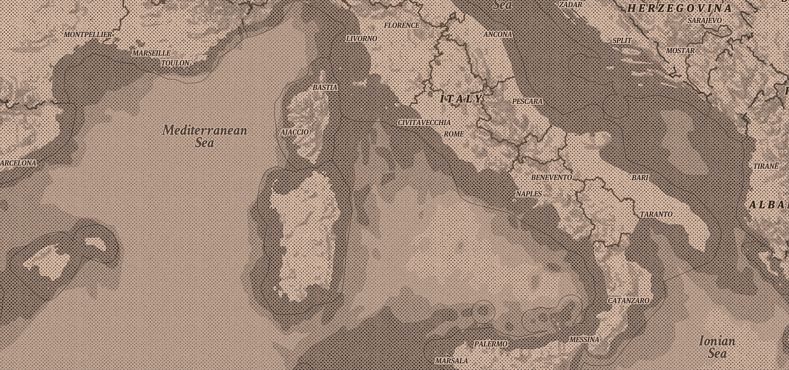
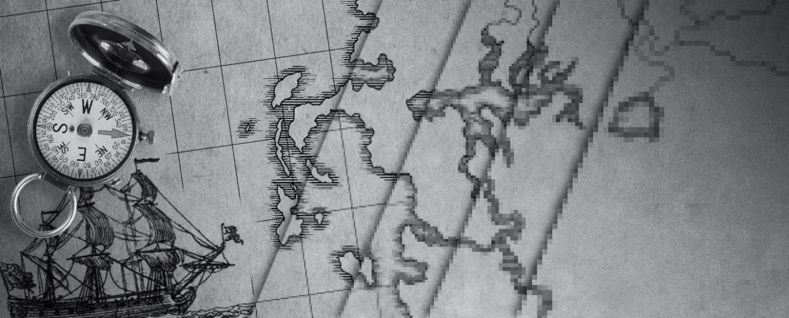
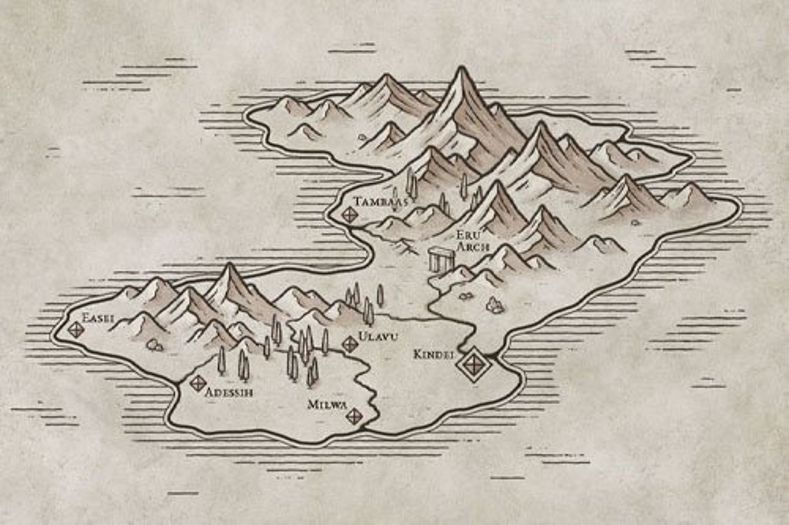
I wanted to make maps that look like the maps you see in history or historical fiction books. Here’s a few examples of the kinds of maps I’m talking about. The maps are from Dan Jones’ The Crusaders and the recent Lionessheart by Catherine Hanley.


So, I went on map safari to learn about map display. In particular, I explored using MapLibre to display maps in a style similar to those seen in books. ChatGPT summarizes the technology more quickly than I can:
OpenStreetMap (OSM) is a global, community-maintained open dataset of geographic features—roads, buildings, boundaries, places, and more—that serves as a foundational source for many modern maps. Tools like OpenMapTiles transform raw OSM data into performant vector tiles, which can then be styled and rendered in the browser or native apps using MapLibre GL, an open-source map rendering engine derived from Mapbox GL. MapTiler builds on this ecosystem by providing hosted vector and raster tiles, terrain, hillshade, and style tools that are compatible with MapLibre, making it easier to deploy production maps without running your own tile infrastructure. Together with related standards and technologies—such as vector tiles (MVT), GeoJSON, sprites, glyphs, and style specifications—this stack enables highly customizable, scalable, and license-friendly web mapping, giving developers full control over cartography while avoiding proprietary lock-in.
Some nomenclature: tiles are small, fixed-size chunks of geographic data—raster images or vector features—served at multiple zoom levels to make maps fast and scalable, while sprites are compact image sheets that bundle many small icons and patterns into a single file to reduce network requests. Vector tiles carry geometry and attributes that are styled client-side, enabling dynamic cartography, whereas sprites provide the visual symbols referenced by a map style for consistent rendering.
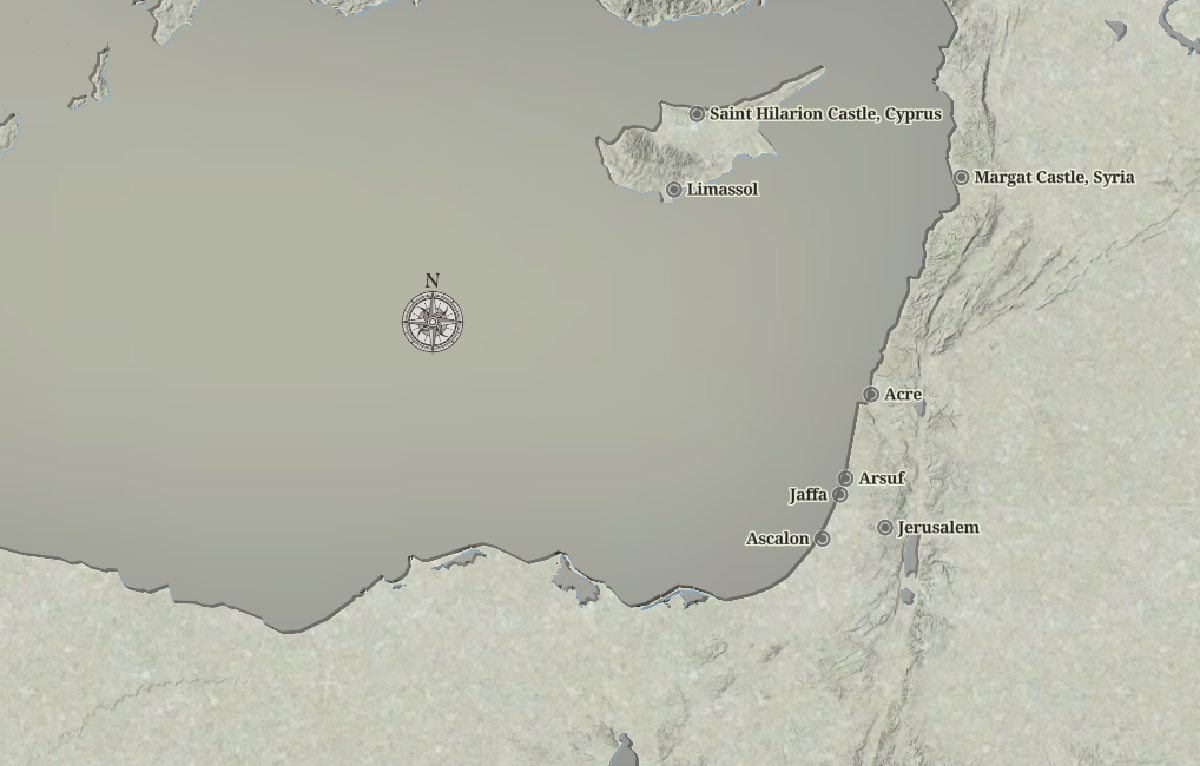
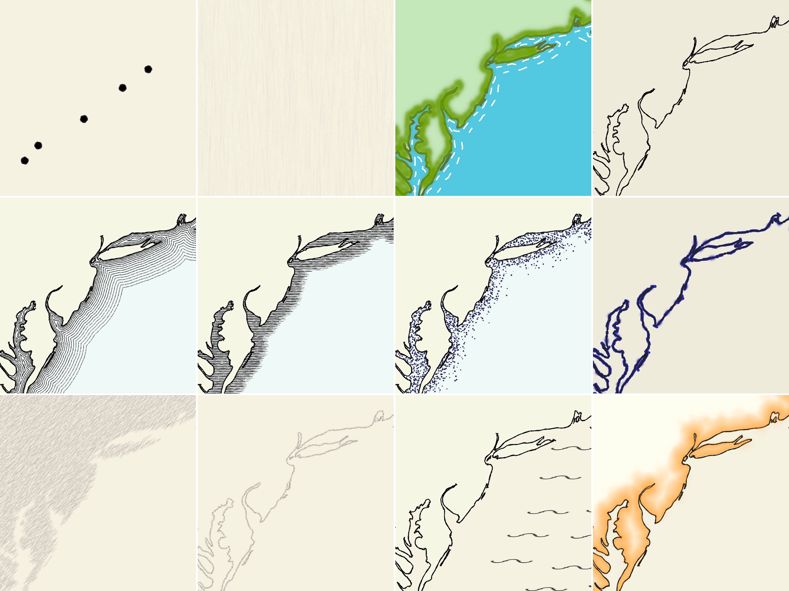
I succeeded in getting something I was reasonably happy with. It looks like this:

TLDR: If you want to play with a live, interactive map, click this link. It which shows the base style of ocean gradient, terrain, and paper texture background.
If you are interested in technical details, my Github repository has all the code, as well as an interactive map you can play with.
The key elements are:
- A map style, which loads tiles and decides how to display them
- Map sprites, the image resources used by the style (in my case, just a paper texture)
- An html file that loads a map using the defined style file, and then renders points on the map using MapLibre GL javascript code.
There are three tile sets used:
- maptiler-hillshade: used to show terrain (ala Google Terrain view)
- land: a maptiler set used to draw lines around coastlines
- land-gradient: a maptiler tile set used to create a dark gradient around coastlines, extending out into oceans
You can see what the file looks like here: bookmap.json. The sprite file is here.
Along the way, I discovered Open Historical Maps, a super cool project that links historical geographical data to the maps (i.e. the geographic boundaries of the Holy Roman Empire in 1187AD.) I created another style that shows major kingdoms and their boundaries; my example map is set during the year 1187 AD as I have been studying the Third Crusade, which began around then. So this second style adds a 4th tile, an Open Historical Map tileset containing the historical data.

What vintage map would be complete without a compass rose? So I included one. You can move it around the map by click & drag if it obscures something.
Live example maps#
If you want to play with live maps:
- Simple map - shows the base style of ocean gradient, terrain, and paper texture background.
- Historical map - the base map, plus inclusion of Open Historical Map kingdom and kingdom boundary data. Year set to 1187 AD.
The map pages allow you to
- Export Map to save the map image to a file (in case you want to include in a blog post!)
- Set POI to change the POI data to your own locations.
The format for POI entry is an array of lat/lon/name/description entries:
[
  [51.5074, -0.1278, "London", "London, England"],
  [48.8566, 2.3522, "Paris", "Paris, France"],
]
Export Map uses some custom code to export the canvas to an image file. I have also included the WaterGIS MapLibre Export plugin for more export options, which you can invoke using the printer icon at bottom left of the map.
Much of this code was created with Claude.AI. Caveat emptor.
Inspirations#
I looked at a number of interesting articles about map styles, vintage map styles in particular. I found these articles particularly interesting and helpful.

Process notes#
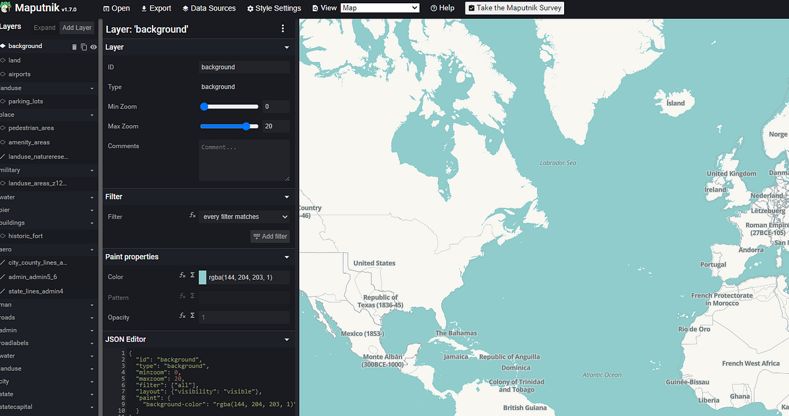
If you want to edit your own styles, use Maputnik. Go to Maputnik, then click Open, which will let you pick some default styles. Or, hit Code Editor and paste in the contents of my bookmap.json file to see (and edit) my book map style.
You can learn more about how to code with Open Historical Maps here.
The code for this repo (including the map pages, the styles, and the sprites) are hosted on github pages.
As a courtesy you should get your own MapTiler API key and replace the key used in bookmap.json.
